Reporting Modernization
I led the redesign and migration of a reporting environment supporting a broad range of business, operational, engineering, and selected customer-facing analytics.
The work included dashboard migration, reporting standards, reusable templates, stakeholder requirements, and coordination across technical and business users.
From Summary to Detail
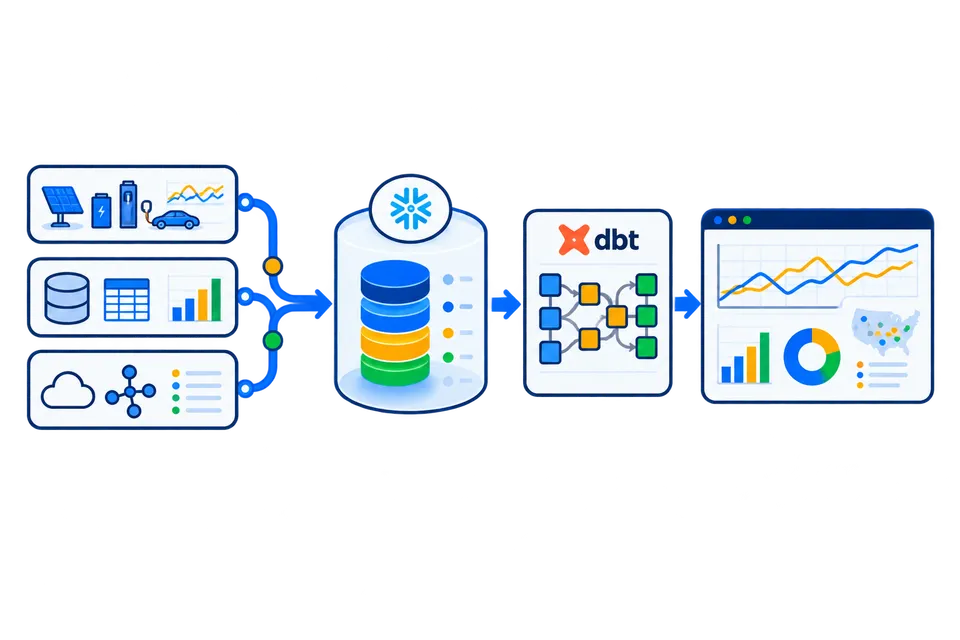
Reporting was organized so that users could move from high-level views to progressively more detailed operational and engineering analysis without duplicating the same underlying metrics across separate dashboards.
Self-Service Analytics
Shared data models and reporting conventions made it easier for teams to explore data consistently while reducing duplicated dashboards and isolated calculation logic.
The reporting layer covered use cases across renewable-energy assets, EV charging, project execution, finance, operations, forecasting, and reliability.