Energy Data Solutions
Menu
Web Framework

Streamlit

Streamlit turns Python analyses into interactive data applications without requiring a separate front-end stack. It is especially useful for rapid expert-facing tools that support dataset exploration, model-result review and visual investigation of scientific or operational questions.

Streamlit

Related skills

  • Data Science

    Data Science

    Extracting insights and building predictive models from data using statistics, machine learning, and programming

  • Data Visualization & Reporting

    Data Visualization & Reporting

    Creating visual representations of data to communicate insights, patterns, and trends effectively

Project steps

  1. Bird Behavior Analysis Around Wind Turbines

    Visualization & Exploration

    Interactive Analysis

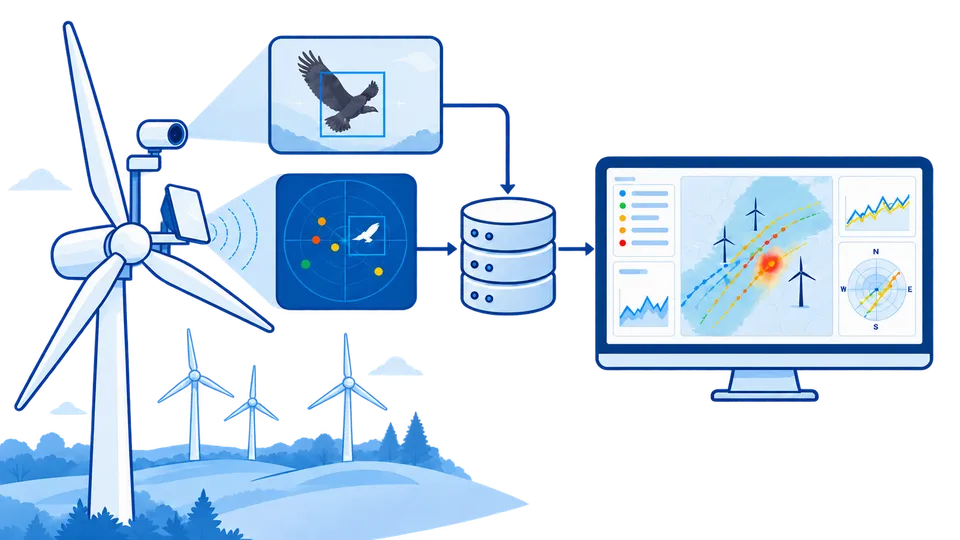
    Developed Streamlit tools for offline exploration of bird-detection and trajectory datasets.

    The interface supported filtering and comparison of detections, trajectories and environmental conditions across different periods and operating conditions.

    Spatial Analysis

    Interactive maps and trajectory plots were used to examine flight paths around turbines, recurring movement patterns and the spatial distribution of bird activity.

    Radar data could additionally be explored in three dimensions using measured position and altitude.

    Behavioral Review

    Visualizations were designed to make individual deterrence events easier to review, including the bird trajectory before and after acoustic signals.


Related projects

Bird Behavior Analysis Around Wind Turbines
R&D2019–2022EDF

Bird Behavior Analysis Around Wind Turbines

At the intersection of biodiversity and wind energy, this project analyzes bird behavior around turbines using camera detections and 3D radar trajectories. It examines flight movements, responses to acoustic deterrence, and links with weather and turbine operation.

View Project