Regional Solar Power Forecasting with Deep Learning
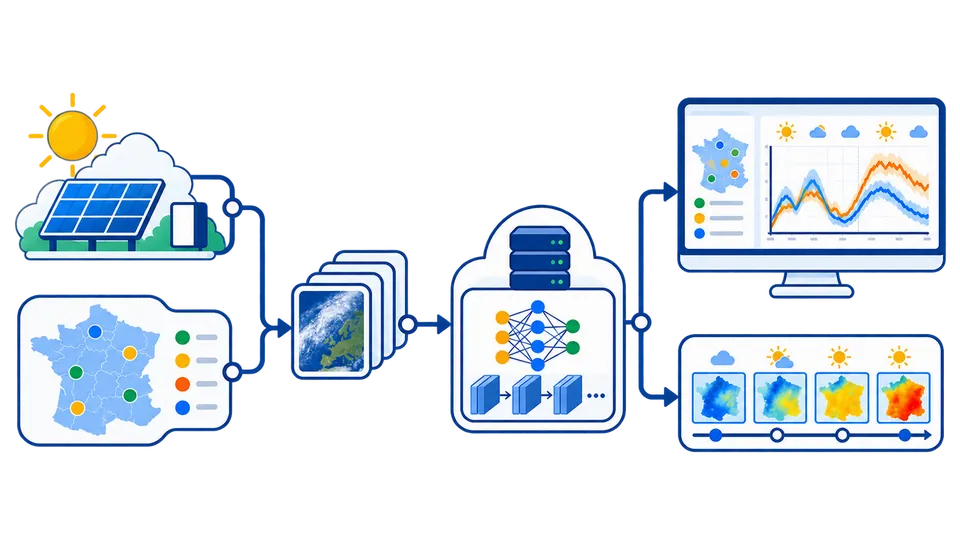
Spatiotemporal forecasting of regional photovoltaic production from Meteosat image sequences using a ConvLSTM model trained and evaluated against measured production and a persistence baseline.
Python provides a common implementation language across data engineering, scientific computing and machine learning. Its ecosystem makes it possible to connect ingestion, analysis, modeling, visualization and application logic while keeping workflows readable, testable and reusable.

Data orchestration and transformation pipelines to deliver high-quality, actionable data
Predicting future values using historical data patterns, statistical models, and machine learning algorithms
Design and development of reliable, scalable software systems
Extracting insights and building predictive models from data using statistics, machine learning, and programming
Creating visual representations of data to communicate insights, patterns, and trends effectively
Applies rigorous scientific methods to explore, test, and validate data-driven ideas.
Prepared aggregated photovoltaic production time series for multiple French departments, together with solar-position features and clear-sky normalization used by the forecasting pipeline.
Processed Meteosat Second Generation image sequences, extracted the geographic areas associated with each forecast region, and aligned them in time with the corresponding PV production series.
Developed a ConvLSTM-based model to learn spatiotemporal relationships between successive satellite images and regional photovoltaic production.
Satellite image sequences were combined with solar-position information to estimate clear-sky-normalized PV production.
Implemented the PyTorch training and validation pipeline for large image and time-series datasets, covering data preparation, model training, checkpointing, and application to unseen periods.
Model outputs were converted back to the PV production scale and compared with measured production and a persistence baseline using standard forecasting metrics.
Evaluated the same modeling pipeline for current-state estimation and short-term forecasting from sequences of satellite images.
Experiments were carried out across multiple geographic areas and time periods to assess the consistency of the approach.
Persistence was used as the reference forecast, providing a simple and interpretable benchmark for evaluating the deep-learning model.
Trained models were applied to held-out periods, with predicted and measured regional PV production compared through time-series analysis and summary metrics.
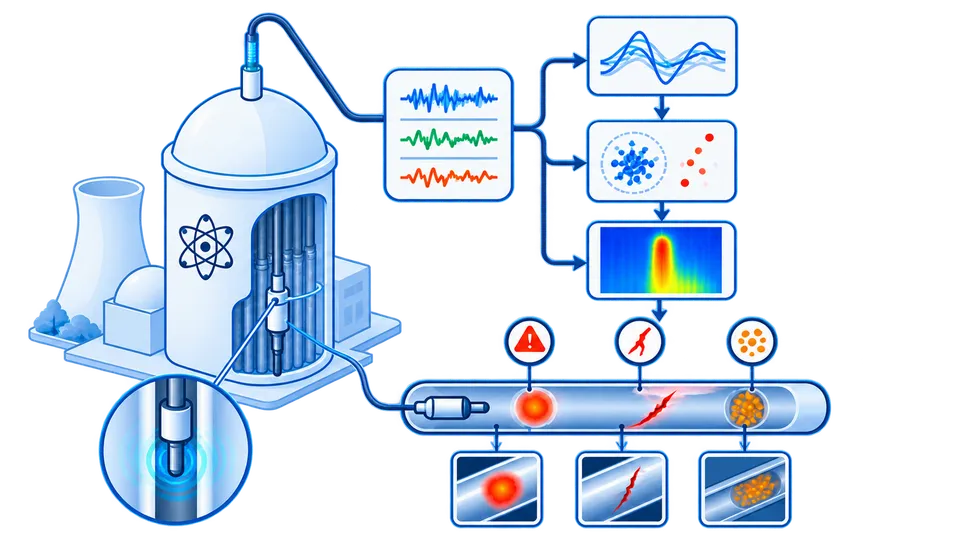
Processed multidimensional signals acquired during periodic eddy-current inspections of steam-generator tubes.
Variations in probe velocity can shift otherwise comparable signal patterns. The processing pipeline therefore realigns inspection signals before they are compared.
Probe displacement is reconstructed from the acquisition sequence and inspection speed. Known geometric landmarks, including tube-support-plate locations, are then used to refine the alignment between the signal and its physical position along the tube.
This provides a consistent basis for comparing signals acquired from geometrically similar tubes.
Dynamic Time Warping (DTW) is used to synchronize comparable inspection signals against a common reference while accounting for local differences in acquisition speed.
This makes local signal deviations easier to distinguish from simple positional misalignment.
After synchronization, Local Outlier Factor (LOF) is applied to identify signals that differ locally from the behavior observed across comparable tubes.
Rather than replacing expert diagnosis, the method highlights potentially anomalous sections and prioritizes them for targeted review by inspection specialists.
Signals are compared within groups of tubes with similar geometry so that expected structural effects are separated as far as possible from atypical responses.
The algorithms were integrated into an application designed for inspection engineers.
Users could navigate inspection campaigns and individual tubes, visualize raw and processed signals, inspect automatically highlighted sections, and review results in their physical context.
The objective was not to replace NDT expertise with an automatic classification system.
Instead, automated screening was used to focus expert attention on the signals most likely to contain unusual behavior, allowing large inspection datasets to be reviewed more efficiently.
The application supported interactive signal analysis, validation of detected anomalies, comparison of inspection results, and generation of outputs for the wider inspection workflow.

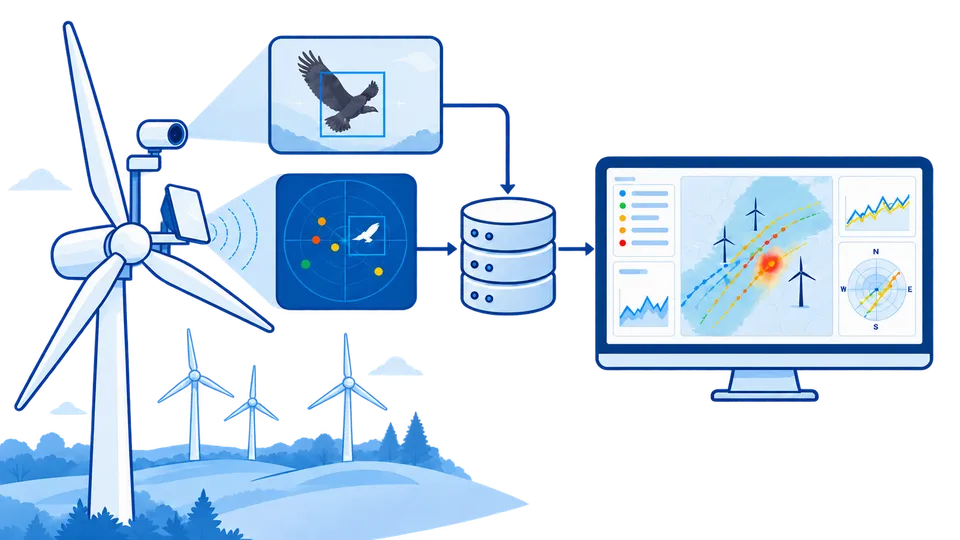
Processed bird-detection events recorded by camera-based monitoring systems deployed on several wind farms.
Detection metadata and video sequences were used to reconstruct approximate trajectories in image space and characterize how birds approached and moved around the rotor area.
A separate study used full-3D bird-radar data collected around wind turbines.
The radar provided trajectories with spatial position, altitude and flight speed, enabling bird movements to be analyzed over a much larger area than with individual turbine cameras.
Trajectory data were combined with meteorological information and turbine operating conditions to study how flight behavior varied with the surrounding environment.
Camera detections were used to evaluate bird behavior around automated acoustic deterrence events.
Trajectories before and after warning or dissuasion signals were compared to determine whether a measurable change in flight direction could be observed and whether the bird subsequently moved away from the rotor area.
The analysis considered indicators including changes in heading, relative proximity to the turbine and differences between trajectories exposed and not exposed to deterrence.
Because the camera systems relied on a single viewpoint, these measurements were treated as image-based trajectory and proximity indicators rather than true 3D positions.
For radar data, KMeans clustering and statistical analysis were used to identify recurring trajectory patterns and characterize bird movements around the wind turbines.
Developed Streamlit tools for offline exploration of bird-detection and trajectory datasets.
The interface supported filtering and comparison of detections, trajectories and environmental conditions across different periods and operating conditions.
Interactive maps and trajectory plots were used to examine flight paths around turbines, recurring movement patterns and the spatial distribution of bird activity.
Radar data could additionally be explored in three dimensions using measured position and altitude.
Visualizations were designed to make individual deterrence events easier to review, including the bird trajectory before and after acoustic signals.
The objective of the camera-based analysis was to determine whether recorded trajectories provided measurable evidence of a behavioral response to acoustic deterrence.
Rather than assuming that a triggered warning was effective, the analysis examined how birds actually changed direction and proximity after the intervention.
The 3D radar study provided a complementary view of bird activity around wind turbines, allowing flight routes, turbine avoidance patterns and relationships with meteorological conditions to be studied over extended periods.
The resulting analyses and visualizations provided technical support for evaluating bird-monitoring and mitigation approaches around wind farms.
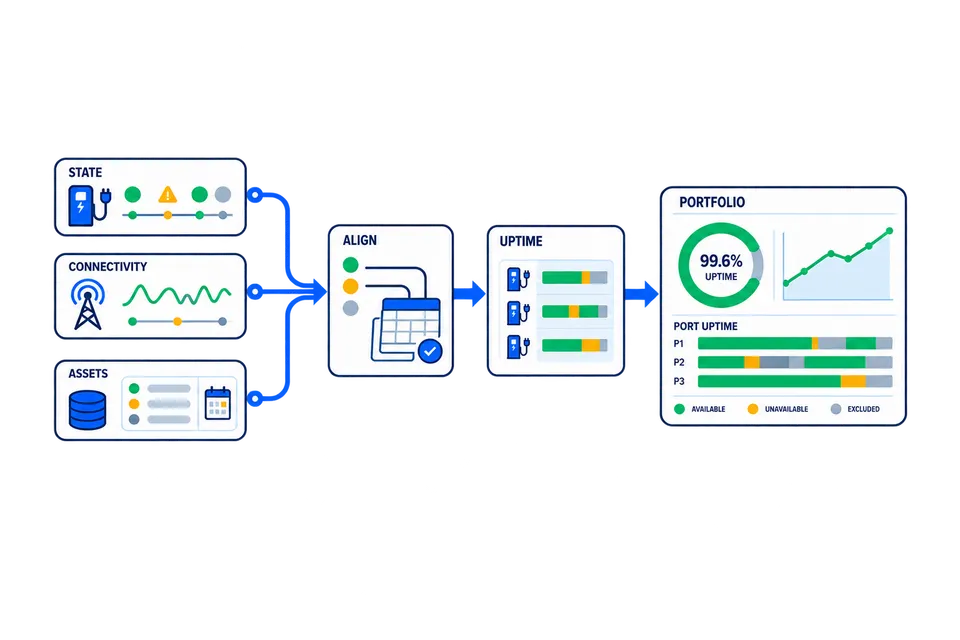
Built a consistent reliability dataset from charger operational states and connectivity information collected across a heterogeneous EV charging network.
For each charging port, operational and online status were combined on a common time basis so that availability could be evaluated consistently across equipment and sites.
Reporting logic also accounted for changes in the charger fleet over time, including commissioning periods, decommissioned or replaced equipment, site reporting windows and asset reassignment.
This ensured that reliability calculations were based on the equipment that was actually expected to be operational during each reporting period.
Developed per-port uptime metrics based on whether charging equipment was both operational and reachable by the charging platform.
Rather than relying on a single status field, the methodology combines several operational signals to provide a more defensible representation of charger availability.
Several complementary uptime metrics were implemented to account for different operating conditions and interpretations of charger availability.
This allowed reliability to be analyzed without forcing every operational scenario into a single definition.
The model incorporates defined reporting periods and approved downtime exclusions so that reliability can be evaluated consistently for operational, customer and reporting use cases.
The methodology was developed in the context of evolving industry and California EVSE reliability requirements while supporting a much broader charging portfolio.
Designed the analytics model around individual charging ports, with derived reliability intervals that could be aggregated consistently from charger level through site and portfolio reporting.
Input data were normalized onto a consistent time basis before aggregation, simplifying the calculation of time-weighted availability across heterogeneous equipment.
Implemented automated validation around asset coverage, reporting periods, downtime exclusions and metric consistency.
The resulting transformation pipeline provided a reproducible definition of uptime rather than relying on dashboard-level calculations or manually maintained metrics.
The models were implemented as production analytics workflows and maintained through version-controlled transformations, automated testing and documented metric definitions.
Developed reporting that allows reliability to be analyzed from portfolio-level summaries down to individual sites and charging ports.
This makes it possible to move from a high-level uptime indicator to the equipment and time periods responsible for changes in the metric.
Reliability metrics were also integrated into customer-facing reporting, providing visibility into charger uptime alongside other EV charging performance information.
The same underlying data model supports operational analysis, internal reporting and customer-facing views, providing a consistent reliability definition across different levels of the organization.
Integrated the uptime framework into recurring operational and customer-facing reporting.
Reporting views supported comparison across the charging portfolio, sites and individual ports.
The same reliability definition was used across these views, keeping interpretations consistent.

Spatiotemporal forecasting of regional photovoltaic production from Meteosat image sequences using a ConvLSTM model trained and evaluated against measured production and a persistence baseline.

Development and industrialization of engineer-facing software combining signal alignment, DTW, and statistical anomaly detection to prioritize atypical steam-generator inspection signals for expert review.

At the intersection of biodiversity and wind energy, this project analyzes bird behavior around turbines using camera detections and 3D radar trajectories. It examines flight movements, responses to acoustic deterrence, and links with weather and turbine operation.

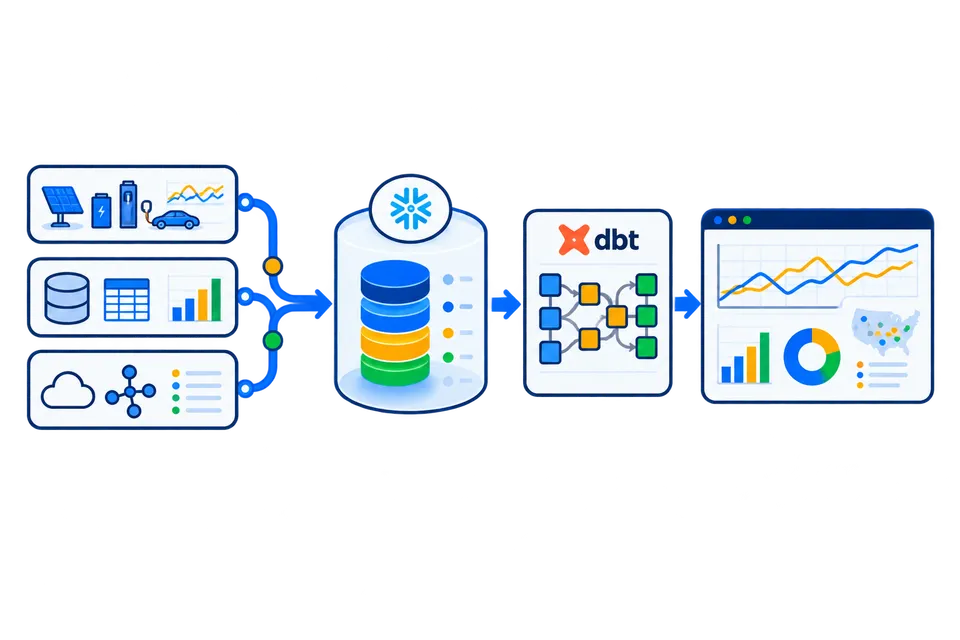
End-to-end development and modernization of a data platform spanning production ingestion, analytics engineering, quality controls, and reporting for operational, business, and customer-facing use cases.

Reliability analytics for 70,000+ managed EV chargers, reconstructing consistent per-port uptime from operational state, connectivity, asset history, and downtime exclusions for operational and customer-facing reporting.